This is a package to create NONMEM Input Format (NIF) data tables from SDTM-formatted clinical study data.
The NONMEM software that is often used for population pharmacokinetic/pharmacodynamic (PK/PD) modeling expects the input data set to follow specific conventions summarized in Bauer, R.J. (2019), NONMEM Tutorial Part I: Description of Commands and Options, With Simple Examples of Population Analysis. CPT Pharmacometrics Syst. Pharmacol., 8: 525-537.
This package provides functions to sequentially aggregate drug administrations, PK/PD observations and covariates into a NONMEM-compliant analysis data set (NIF data set), and tools to explore and visualize NIF data sets.
Installation
You can install the development version of nif like this:
devtools::install_github("rstrotmann/nif", build_vignettes=TRUE)Example
Generate a NIF data set
This is a very basic example using sample SDTM data from a fictional single ascending dose study to create a NIF data set using make_nif():
library(nif)
library(tidyverse)

sdtm <- examplinib_sad

nif <- nif() %>%
  add_administration(sdtm, "EXAMPLINIB", analyte = "RS2023") %>%
  add_observation(sdtm, "pc", "RS2023", analyte = "RS2023")

head(nif)
#>   REF ID    STUDYID           USUBJID AGE SEX  RACE HEIGHT WEIGHT     BMI
#> 1   1  1 2023000001 20230000011010001  43   0 WHITE  187.4     77 21.9256
#> 2   2  1 2023000001 20230000011010001  43   0 WHITE  187.4     77 21.9256
#> 3   3  1 2023000001 20230000011010001  43   0 WHITE  187.4     77 21.9256
#> 4   4  1 2023000001 20230000011010001  43   0 WHITE  187.4     77 21.9256
#> 5   5  1 2023000001 20230000011010001  43   0 WHITE  187.4     77 21.9256
#> 6   6  1 2023000001 20230000011010001  43   0 WHITE  187.4     77 21.9256
#>                   DTC TIME NTIME TAFD TAD EVID AMT ANALYTE CMT PARENT TRTDY
#> 1 2000-12-31 10:18:00  0.0   0.0  0.0 0.0    1   5  RS2023   1 RS2023     1
#> 2 2000-12-31 10:18:00  0.0   0.0  0.0 0.0    0   0  RS2023   2 RS2023     1
#> 3 2000-12-31 10:48:00  0.5   0.5  0.5 0.5    0   0  RS2023   2 RS2023     1
#> 4 2000-12-31 11:18:00  1.0   1.0  1.0 1.0    0   0  RS2023   2 RS2023     1
#> 5 2000-12-31 11:48:00  1.5   1.5  1.5 1.5    0   0  RS2023   2 RS2023     1
#> 6 2000-12-31 12:18:00  2.0   2.0  2.0 2.0    0   0  RS2023   2 RS2023     1
#>   METABOLITE DOSE MDV ACTARMCD IMPUTATION      DV
#> 1      FALSE    5   1       C1                 NA
#> 2      FALSE    5   0       C1             0.0000
#> 3      FALSE    5   0       C1            40.7852
#> 4      FALSE    5   0       C1            48.5530
#> 5      FALSE    5   0       C1            44.0391
#> 6      FALSE    5   0       C1            34.0729
In many cases, you may want to add further covariates, e.g., baseline creatinine from the LB domain:
nif <- nif %>%
mutate(COHORT = ACTARMCD) %>%
add_baseline(sdtm, "lb", "CREAT") %>%
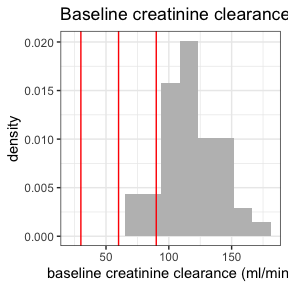
add_bl_crcl()
#> baseline_filter for BL_CREAT set to LBBLFL == 'Y'Data exploration
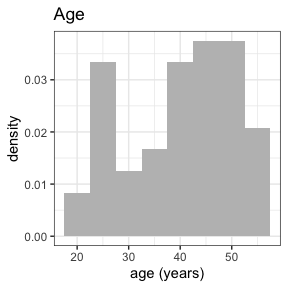
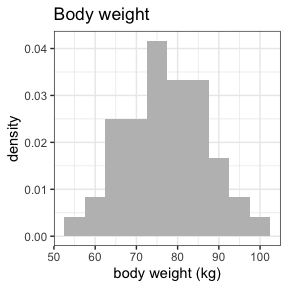
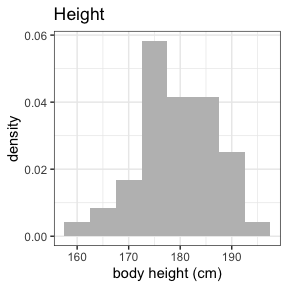
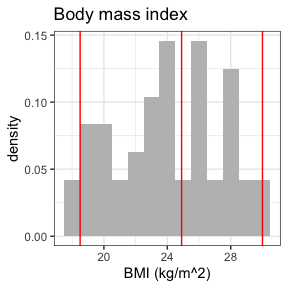
The nif package provides a range of functions to explore and summarize NIF files:
summary(nif)
#> ----- NONMEM Input Format (NIF) data summary -----
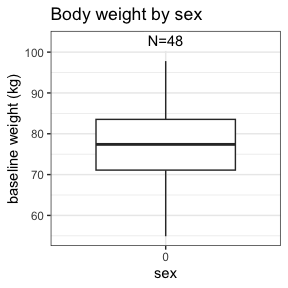
#> Data from 48 subjects across one study:
#> STUDYID N
#> 2023000001 48
#>
#> Sex distribution:
#> SEX N percent
#> male 48 100
#> female 0 0
#>
#> Renal impairment class:
#> CLASS N percent
#> normal 46 95.8
#> mild 2 4.2
#> moderate 0 0
#> severe 0 0
#>
#> Treatments:
#> RS2023
#>
#> Analytes:
#> RS2023
#>
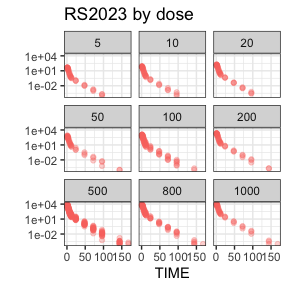
#> Subjects per dose level:
#> COHORT RS2023 N
#> C1 5 3
#> C10 500 12
#> C2 10 3
#> C3 20 3
#> C4 50 3
#> C5 100 6
#> C6 200 3
#> C7 500 6
#> C8 800 6
#> C9 1000 3
#>
#> 816 observations:
#> CMT ANALYTE N
#> 2 RS2023 816
#>
#> Sampling schedule:
#> NTIME RS2023
#> 0 X
#> 0.5 X
#> 1 X
#> 1.5 X
#> 2 X
#> 3 X
#> 4 X
#> 6 X
#> 8 X
#> 10 X
#> (7 more rows)
#>
#> Subjects with dose reductions
#> RS2023
#> 0
#>
#> Treatment duration overview:
#> PARENT min max mean median
#> RS2023 1 1 1 1
#>
#> Hash: a14674b06b234d32d526f9c20f0d0e82
#> Last DTC: 2001-03-02 11:31:00
invisible(capture.output(
summary(nif) %>%
plot()
))

Further information
For further guidance see the help for individual functions and the project website on github pages.