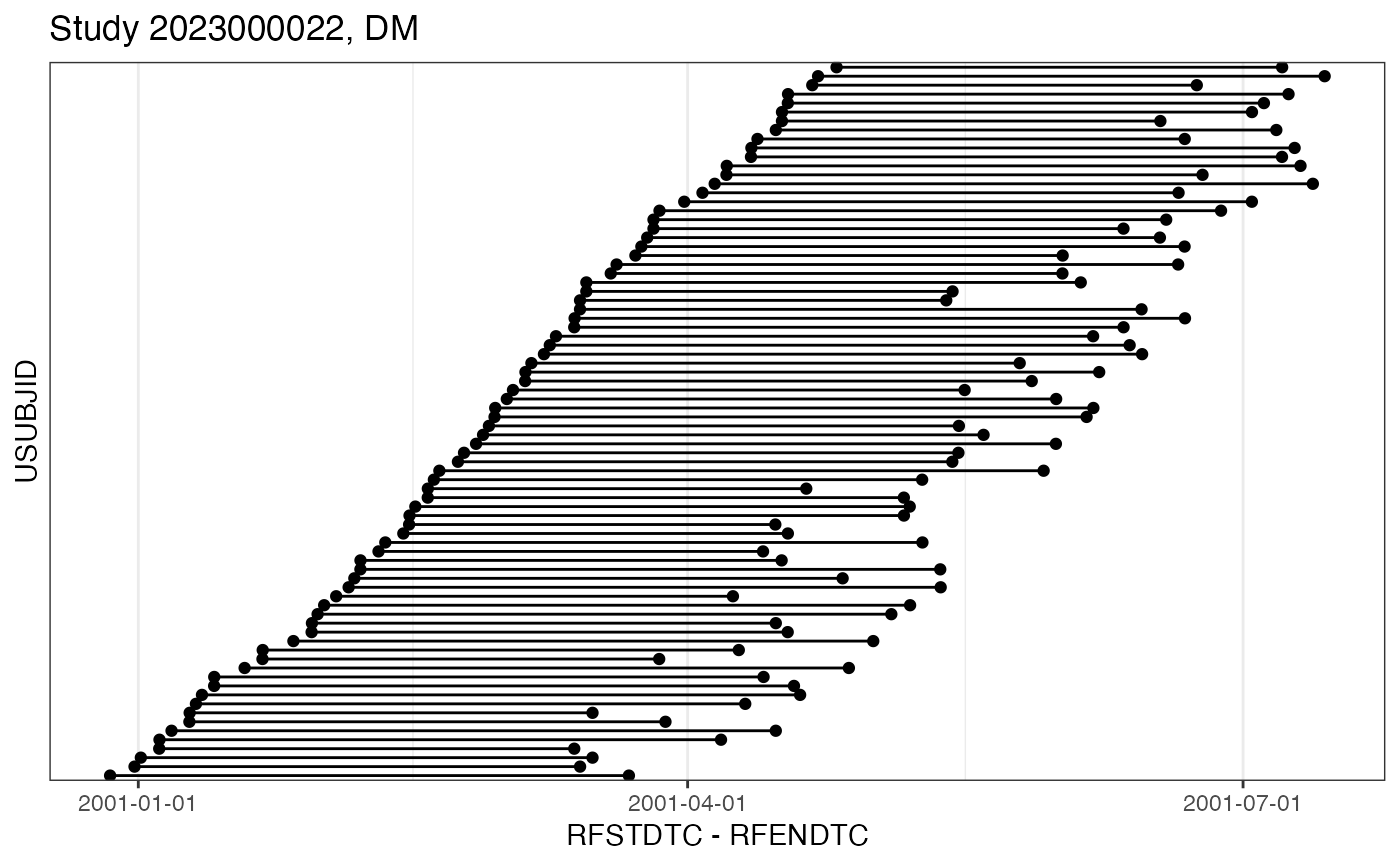
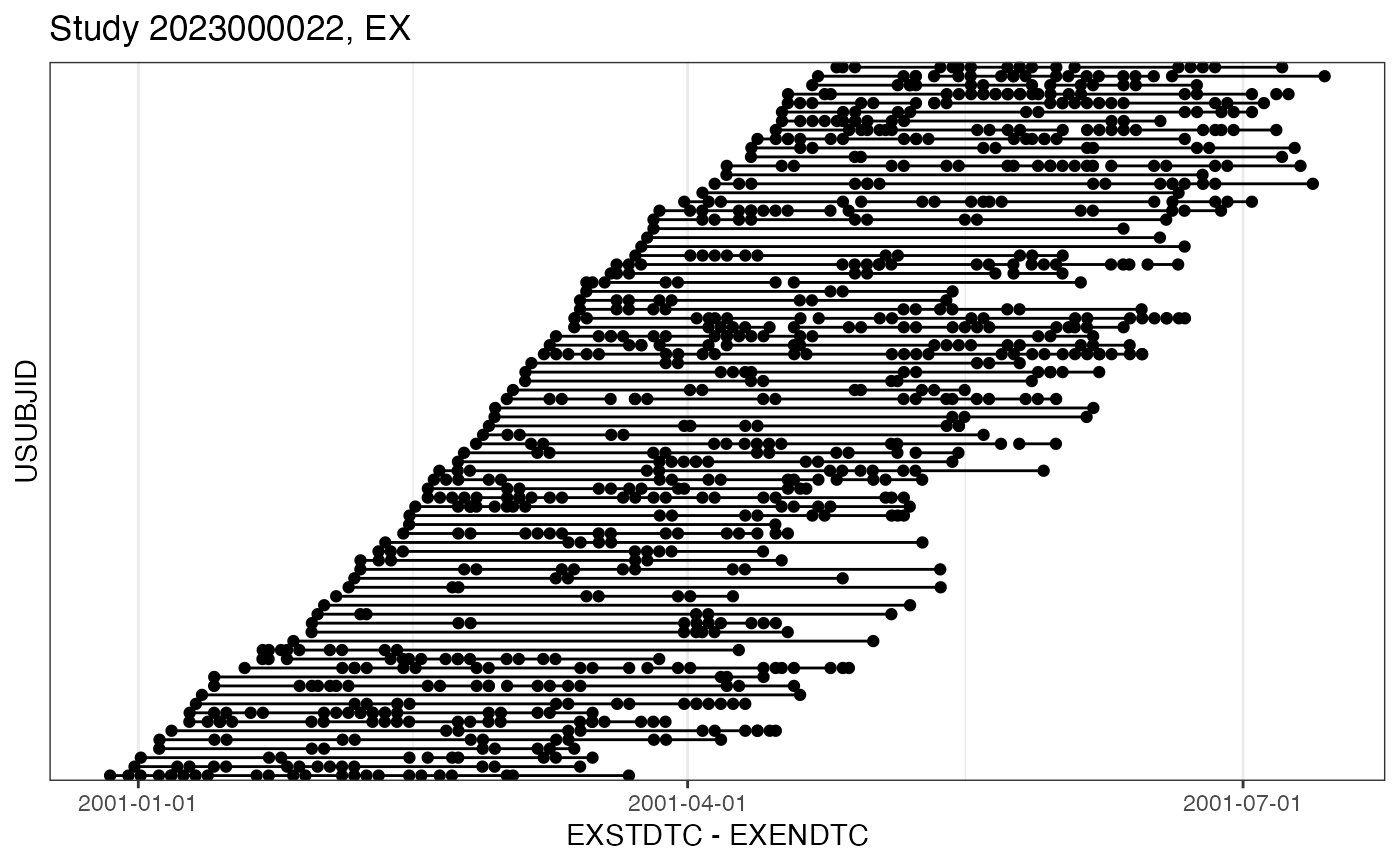
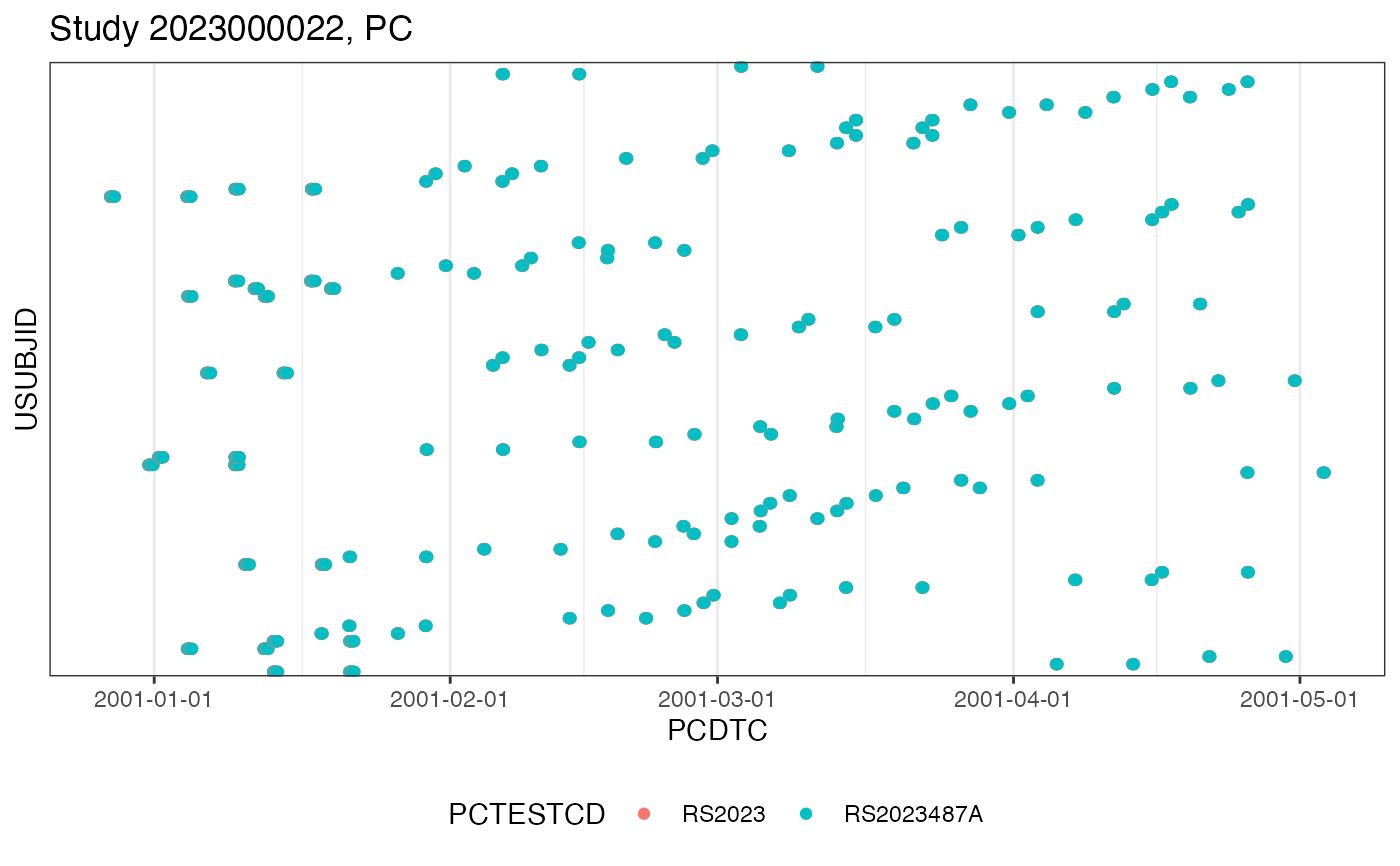
Plot SDTM object
Usage
# S3 method for class 'sdtm'
plot(
  x,
  domain = "dm",
  usubjid = NULL,
  lines = FALSE,
  points = TRUE,
  analyte = NULL,
  log = FALSE,
  legend = FALSE,
  subject_filter = TRUE,
  ...
)
Arguments
- x
The sdtm object.
- domain
The domain to be plotted, defaults to 'dm'.
- usubjid
The USUBJID to filter for. All subjects if
NULL(default).- lines
Boolean whether to plot lines.
- points
Boolean whether to plot points.
- analyte
The analyte to be plotted as character.
- log
Boolean whether to use a logarithmic y axis.
- legend
Show legend, as logical.
- subject_filter
Filter term as character.
- ...
Further printing parameters.