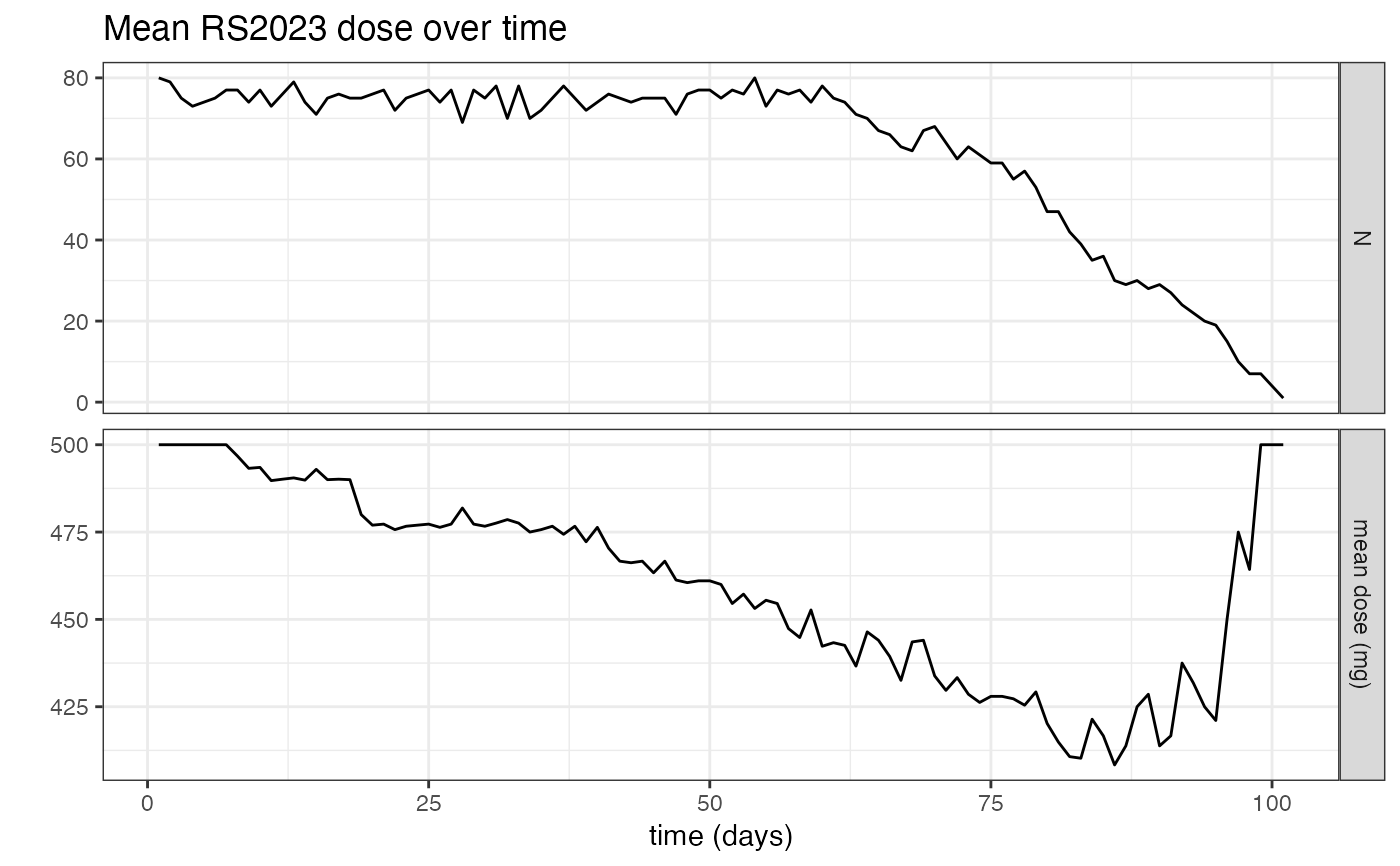
This function plots the mean dose per day over time
Usage
mean_dose_plot(obj, analyte = NULL, title = NULL)
Arguments
- obj
A NIF object.
- analyte
The compound as character (i.e., the ANALYTE within the data
set).
- title
The plot title as character.
Examples
mean_dose_plot(examplinib_poc_nif)