Analyze in vitro CYP induction data
indmod.Rd![[Experimental]](figures/lifecycle-experimental.svg)
For each hepatocyte donor and CYP isoform, fit a hyperbolic Emax model
to vehicle-normalized mRNA fold-change (FOLD) from an
induction_experiment.
Value
A named list:
dataNested tibble: raw curve,nlsLMfit, tidy coefficients, andemax_obsfor each donor and isoform.fold_plotggplot of observedFOLDand the fitted curves.ind_paramTidy coefficient table (term,estimate, …) by isoform and donor. With the defaultuse_emax_obs = TRUEthe only fitted term isec50;emax_obsis a separate column.downregulationTibble flagging donor/object combinations with suspected downregulation.
Details
Fit Emax / EC50 curves to in vitro CYP mRNA induction
Only SAMPLE == "test" rows with CONC > 0 are used. The model is
$$f(C) = 1 + \frac{E_{max} \cdot C}{EC_{50} + C}$$
which is an Emax relationship with baseline 1 (vehicle) and Hill slope
1.
Emax is fold-increase (fold-change minus 1), not
fold-change. Observed Emax is max(FOLD) - 1.
By default (use_emax_obs = TRUE) that observed value is held fixed
and only EC50 is estimated. If use_emax_obs = FALSE, both
Emax and EC50 are estimated.
The fit assumes fold-change rises with concentration. Concentration-
dependent down-regulation (see induction_downregulation()) is not
modelled and will yield unusable parameters.
static_cyp_induction_risk() treats emax >= 2 as ICH ≥ 2-fold
induction. Values from this function are fold-increase, so a 2.4-fold
curve has emax 1.4 and would be called no risk if passed through
unchanged.
Examples
indmod(examplinib_in_vitro_ind)
#> $downregulation
#> # A tibble: 6 × 8
#> OBJECT DONOR n min_fold max_fold fold_maxc rho downregulation
#> <chr> <chr> <int> <dbl> <dbl> <dbl> <dbl> <lgl>
#> 1 CYP1A2 A 4 1.38 7.37 7.37 1 FALSE
#> 2 CYP1A2 B 4 1.24 5.09 5.09 1 FALSE
#> 3 CYP1A2 C 4 1.56 4.15 4.15 1 FALSE
#> 4 CYP3A4 A 7 0.904 6.33 6.33 1 FALSE
#> 5 CYP3A4 B 8 0.655 2.31 2.31 0.619 FALSE
#> 6 CYP3A4 C 8 0.648 1.58 1.58 0.238 FALSE
#>
#> $data
#> # A tibble: 6 × 7
#> # Rowwise: DONOR, OBJECT, ID
#> DONOR OBJECT ID data emax_obs mod modpar
#> <chr> <chr> <chr> <list<tibble[,5]>> <dbl> <list> <list>
#> 1 A CYP1A2 CYP1A2_A [4 × 5] 6.37 <nls> <tibble [2 × 5]>
#> 2 A CYP3A4 CYP3A4_A [8 × 5] 5.33 <nls> <tibble [2 × 5]>
#> 3 B CYP1A2 CYP1A2_B [4 × 5] 4.09 <nls> <tibble [2 × 5]>
#> 4 B CYP3A4 CYP3A4_B [8 × 5] 1.31 <nls> <tibble [2 × 5]>
#> 5 C CYP1A2 CYP1A2_C [4 × 5] 3.15 <nls> <tibble [2 × 5]>
#> 6 C CYP3A4 CYP3A4_C [8 × 5] 0.585 <nls> <tibble [2 × 5]>
#>
#> $fold_plot
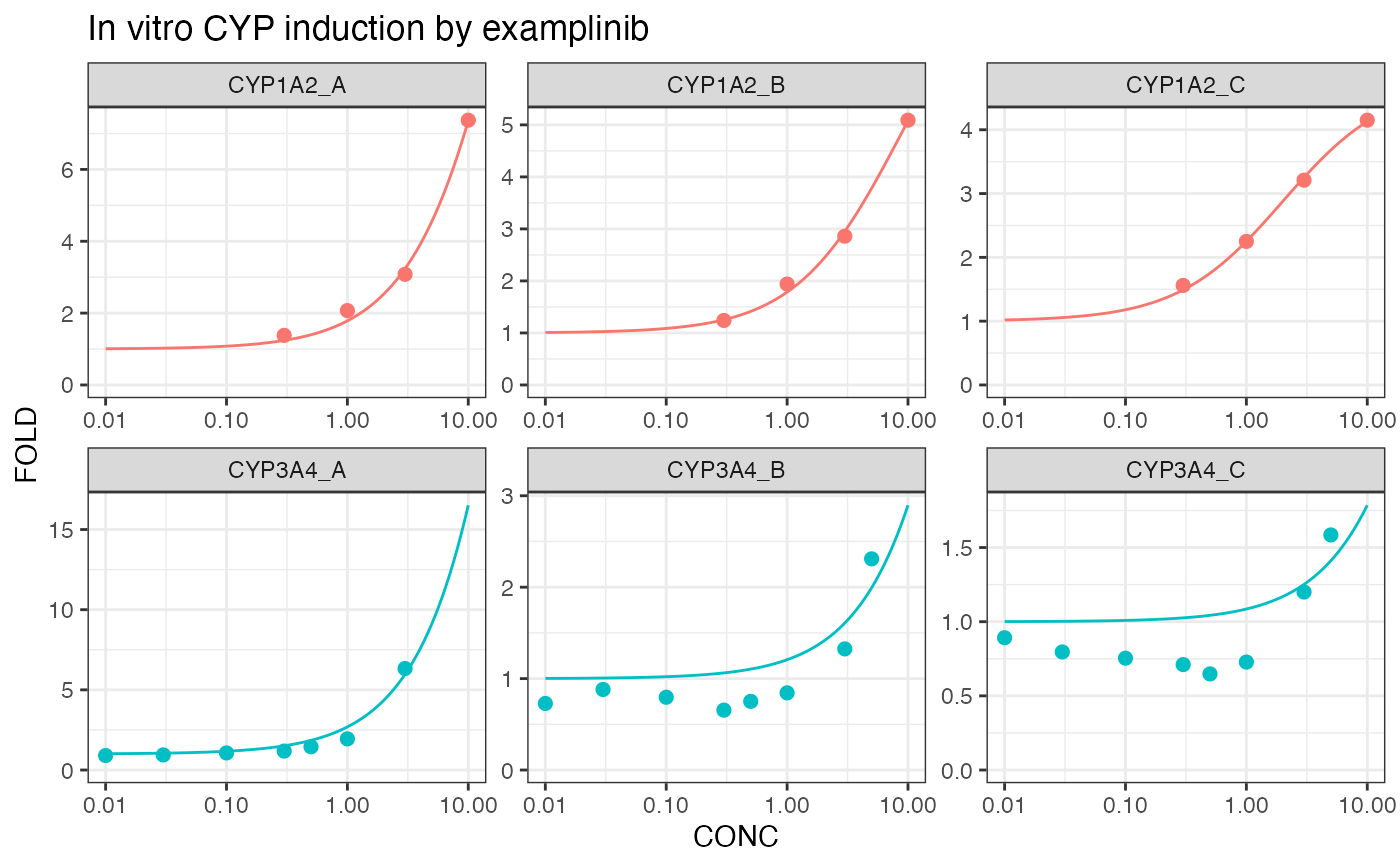 #>
#> $ind_param
#> # A tibble: 12 × 8
#> OBJECT DONOR term emax_obs estimate std.error statistic p.value
#> <chr> <chr> <chr> <dbl> <dbl> <dbl> <dbl> <dbl>
#> 1 CYP1A2 A ec50 6.37 37.3 29.2 1.28 0.329
#> 2 CYP1A2 A emax 6.37 30.1 19.0 1.58 0.254
#> 3 CYP1A2 B ec50 4.09 8.71 1.92 4.53 0.0455
#> 4 CYP1A2 B emax 4.09 7.62 0.917 8.31 0.0142
#> 5 CYP1A2 C ec50 3.15 2.00 0.168 11.9 0.00696
#> 6 CYP1A2 C emax 3.15 3.75 0.108 34.8 0.000826
#> 7 CYP3A4 A ec50 5.33 100 1166. 0.0857 0.935
#> 8 CYP3A4 A emax 5.33 171. 1938. 0.0880 0.933
#> 9 CYP3A4 B ec50 1.31 100 2811. 0.0356 0.973
#> 10 CYP3A4 B emax 1.31 20.9 562. 0.0371 0.972
#> 11 CYP3A4 C ec50 0.585 100 5760. 0.0174 0.987
#> 12 CYP3A4 C emax 0.585 8.64 477. 0.0181 0.986
#>
indmod(induction_experiment(examplinib_in_vitro_ind, "examplinib"))
#> $downregulation
#> # A tibble: 6 × 8
#> OBJECT DONOR n min_fold max_fold fold_maxc rho downregulation
#> <chr> <chr> <int> <dbl> <dbl> <dbl> <dbl> <lgl>
#> 1 CYP1A2 A 4 1.38 7.37 7.37 1 FALSE
#> 2 CYP1A2 B 4 1.24 5.09 5.09 1 FALSE
#> 3 CYP1A2 C 4 1.56 4.15 4.15 1 FALSE
#> 4 CYP3A4 A 7 0.904 6.33 6.33 1 FALSE
#> 5 CYP3A4 B 8 0.655 2.31 2.31 0.619 FALSE
#> 6 CYP3A4 C 8 0.648 1.58 1.58 0.238 FALSE
#>
#> $data
#> # A tibble: 6 × 7
#> # Rowwise: DONOR, OBJECT, ID
#> DONOR OBJECT ID data emax_obs mod modpar
#> <chr> <chr> <chr> <list<tibble[,5]>> <dbl> <list> <list>
#> 1 A CYP1A2 CYP1A2_A [4 × 5] 6.37 <nls> <tibble [2 × 5]>
#> 2 A CYP3A4 CYP3A4_A [8 × 5] 5.33 <nls> <tibble [2 × 5]>
#> 3 B CYP1A2 CYP1A2_B [4 × 5] 4.09 <nls> <tibble [2 × 5]>
#> 4 B CYP3A4 CYP3A4_B [8 × 5] 1.31 <nls> <tibble [2 × 5]>
#> 5 C CYP1A2 CYP1A2_C [4 × 5] 3.15 <nls> <tibble [2 × 5]>
#> 6 C CYP3A4 CYP3A4_C [8 × 5] 0.585 <nls> <tibble [2 × 5]>
#>
#> $fold_plot
#>
#> $ind_param
#> # A tibble: 12 × 8
#> OBJECT DONOR term emax_obs estimate std.error statistic p.value
#> <chr> <chr> <chr> <dbl> <dbl> <dbl> <dbl> <dbl>
#> 1 CYP1A2 A ec50 6.37 37.3 29.2 1.28 0.329
#> 2 CYP1A2 A emax 6.37 30.1 19.0 1.58 0.254
#> 3 CYP1A2 B ec50 4.09 8.71 1.92 4.53 0.0455
#> 4 CYP1A2 B emax 4.09 7.62 0.917 8.31 0.0142
#> 5 CYP1A2 C ec50 3.15 2.00 0.168 11.9 0.00696
#> 6 CYP1A2 C emax 3.15 3.75 0.108 34.8 0.000826
#> 7 CYP3A4 A ec50 5.33 100 1166. 0.0857 0.935
#> 8 CYP3A4 A emax 5.33 171. 1938. 0.0880 0.933
#> 9 CYP3A4 B ec50 1.31 100 2811. 0.0356 0.973
#> 10 CYP3A4 B emax 1.31 20.9 562. 0.0371 0.972
#> 11 CYP3A4 C ec50 0.585 100 5760. 0.0174 0.987
#> 12 CYP3A4 C emax 0.585 8.64 477. 0.0181 0.986
#>
indmod(induction_experiment(examplinib_in_vitro_ind, "examplinib"))
#> $downregulation
#> # A tibble: 6 × 8
#> OBJECT DONOR n min_fold max_fold fold_maxc rho downregulation
#> <chr> <chr> <int> <dbl> <dbl> <dbl> <dbl> <lgl>
#> 1 CYP1A2 A 4 1.38 7.37 7.37 1 FALSE
#> 2 CYP1A2 B 4 1.24 5.09 5.09 1 FALSE
#> 3 CYP1A2 C 4 1.56 4.15 4.15 1 FALSE
#> 4 CYP3A4 A 7 0.904 6.33 6.33 1 FALSE
#> 5 CYP3A4 B 8 0.655 2.31 2.31 0.619 FALSE
#> 6 CYP3A4 C 8 0.648 1.58 1.58 0.238 FALSE
#>
#> $data
#> # A tibble: 6 × 7
#> # Rowwise: DONOR, OBJECT, ID
#> DONOR OBJECT ID data emax_obs mod modpar
#> <chr> <chr> <chr> <list<tibble[,5]>> <dbl> <list> <list>
#> 1 A CYP1A2 CYP1A2_A [4 × 5] 6.37 <nls> <tibble [2 × 5]>
#> 2 A CYP3A4 CYP3A4_A [8 × 5] 5.33 <nls> <tibble [2 × 5]>
#> 3 B CYP1A2 CYP1A2_B [4 × 5] 4.09 <nls> <tibble [2 × 5]>
#> 4 B CYP3A4 CYP3A4_B [8 × 5] 1.31 <nls> <tibble [2 × 5]>
#> 5 C CYP1A2 CYP1A2_C [4 × 5] 3.15 <nls> <tibble [2 × 5]>
#> 6 C CYP3A4 CYP3A4_C [8 × 5] 0.585 <nls> <tibble [2 × 5]>
#>
#> $fold_plot
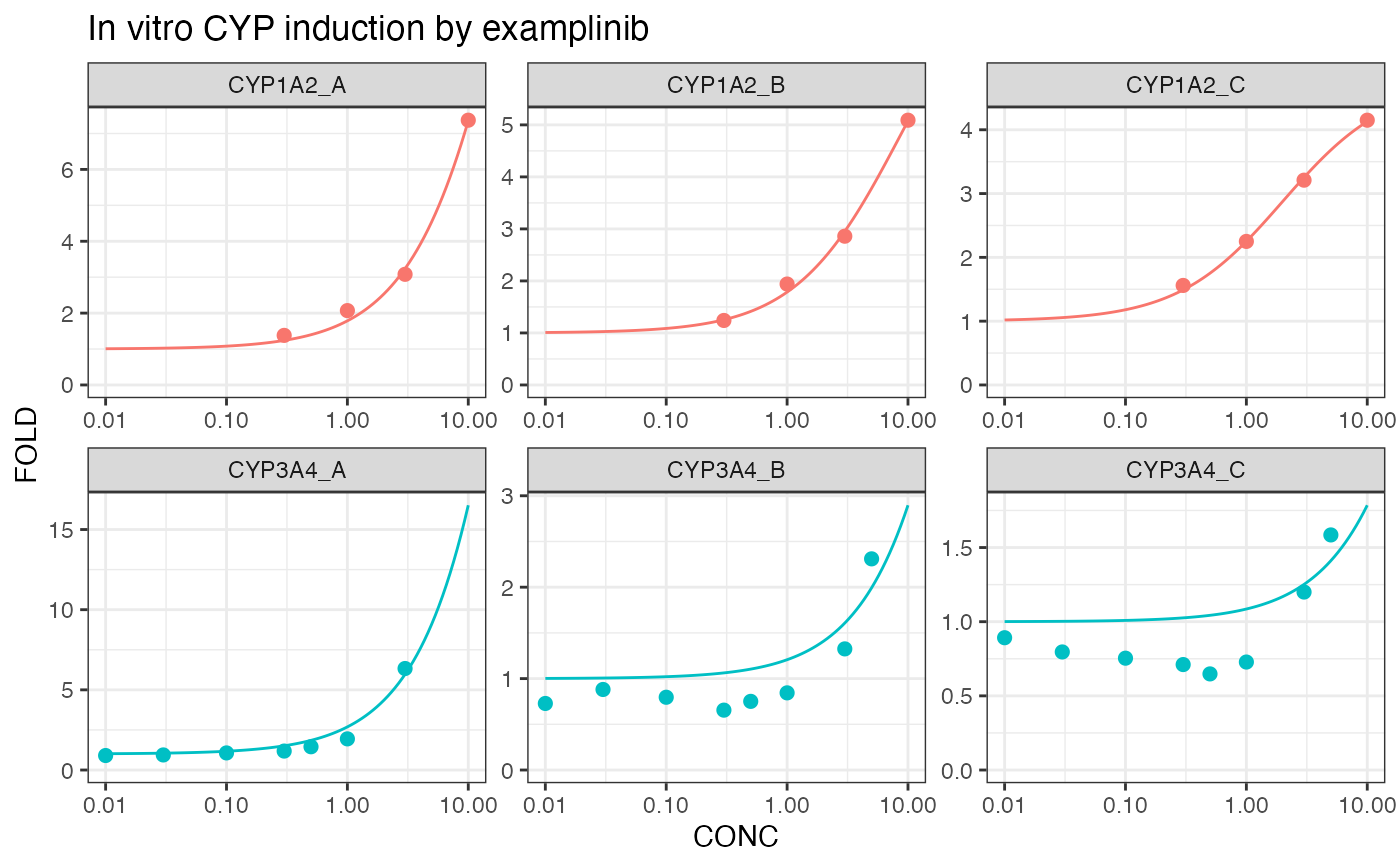 #>
#> $ind_param
#> # A tibble: 12 × 8
#> OBJECT DONOR term emax_obs estimate std.error statistic p.value
#> <chr> <chr> <chr> <dbl> <dbl> <dbl> <dbl> <dbl>
#> 1 CYP1A2 A ec50 6.37 37.3 29.2 1.28 0.329
#> 2 CYP1A2 A emax 6.37 30.1 19.0 1.58 0.254
#> 3 CYP1A2 B ec50 4.09 8.71 1.92 4.53 0.0455
#> 4 CYP1A2 B emax 4.09 7.62 0.917 8.31 0.0142
#> 5 CYP1A2 C ec50 3.15 2.00 0.168 11.9 0.00696
#> 6 CYP1A2 C emax 3.15 3.75 0.108 34.8 0.000826
#> 7 CYP3A4 A ec50 5.33 100 1166. 0.0857 0.935
#> 8 CYP3A4 A emax 5.33 171. 1938. 0.0880 0.933
#> 9 CYP3A4 B ec50 1.31 100 2811. 0.0356 0.973
#> 10 CYP3A4 B emax 1.31 20.9 562. 0.0371 0.972
#> 11 CYP3A4 C ec50 0.585 100 5760. 0.0174 0.987
#> 12 CYP3A4 C emax 0.585 8.64 477. 0.0181 0.986
#>
indmod(induction_experiment(examplinib_in_vitro_ind1, "examplinib"))
#> Warning: Check for down-regulation of CYP1A2, CYP2B6 and CYP3A4 by examplinib
#> $downregulation
#> # A tibble: 9 × 8
#> OBJECT DONOR n min_fold max_fold fold_maxc rho downregulation
#> <chr> <chr> <int> <dbl> <dbl> <dbl> <dbl> <lgl>
#> 1 CYP1A2 A 4 0.087 0.951 0.087 -1 TRUE
#> 2 CYP1A2 B 4 0.188 1.54 0.188 -0.8 TRUE
#> 3 CYP1A2 C 4 0.072 1.09 0.072 -1 TRUE
#> 4 CYP2B6 A 4 0.188 1.07 0.188 -0.8 TRUE
#> 5 CYP2B6 B 4 0.341 1.36 0.341 -0.8 TRUE
#> 6 CYP2B6 C 4 0.107 0.978 0.107 -1 TRUE
#> 7 CYP3A4 A 4 0.285 0.973 0.285 -0.2 TRUE
#> 8 CYP3A4 B 4 0.293 1.79 0.293 -0.8 TRUE
#> 9 CYP3A4 C 4 0.286 1.06 0.286 -0.8 TRUE
#>
#> $data
#> # A tibble: 9 × 7
#> # Rowwise: DONOR, OBJECT, ID
#> DONOR OBJECT ID data emax_obs mod modpar
#> <chr> <chr> <chr> <list<tibble[,4]>> <dbl> <list> <list>
#> 1 A CYP1A2 CYP1A2_A [4 × 4] -0.0490 <nls> <tibble [2 × 5]>
#> 2 A CYP2B6 CYP2B6_A [4 × 4] 0.0690 <nls> <tibble [2 × 5]>
#> 3 A CYP3A4 CYP3A4_A [4 × 4] -0.0270 <nls> <tibble [2 × 5]>
#> 4 B CYP1A2 CYP1A2_B [4 × 4] 0.535 <nls> <tibble [2 × 5]>
#> 5 B CYP2B6 CYP2B6_B [4 × 4] 0.356 <nls> <tibble [2 × 5]>
#> 6 B CYP3A4 CYP3A4_B [4 × 4] 0.79 <nls> <tibble [2 × 5]>
#> 7 C CYP1A2 CYP1A2_C [4 × 4] 0.0920 <nls> <tibble [2 × 5]>
#> 8 C CYP2B6 CYP2B6_C [4 × 4] -0.0220 <nls> <tibble [2 × 5]>
#> 9 C CYP3A4 CYP3A4_C [4 × 4] 0.0600 <nls> <tibble [2 × 5]>
#>
#> $fold_plot
#>
#> $ind_param
#> # A tibble: 12 × 8
#> OBJECT DONOR term emax_obs estimate std.error statistic p.value
#> <chr> <chr> <chr> <dbl> <dbl> <dbl> <dbl> <dbl>
#> 1 CYP1A2 A ec50 6.37 37.3 29.2 1.28 0.329
#> 2 CYP1A2 A emax 6.37 30.1 19.0 1.58 0.254
#> 3 CYP1A2 B ec50 4.09 8.71 1.92 4.53 0.0455
#> 4 CYP1A2 B emax 4.09 7.62 0.917 8.31 0.0142
#> 5 CYP1A2 C ec50 3.15 2.00 0.168 11.9 0.00696
#> 6 CYP1A2 C emax 3.15 3.75 0.108 34.8 0.000826
#> 7 CYP3A4 A ec50 5.33 100 1166. 0.0857 0.935
#> 8 CYP3A4 A emax 5.33 171. 1938. 0.0880 0.933
#> 9 CYP3A4 B ec50 1.31 100 2811. 0.0356 0.973
#> 10 CYP3A4 B emax 1.31 20.9 562. 0.0371 0.972
#> 11 CYP3A4 C ec50 0.585 100 5760. 0.0174 0.987
#> 12 CYP3A4 C emax 0.585 8.64 477. 0.0181 0.986
#>
indmod(induction_experiment(examplinib_in_vitro_ind1, "examplinib"))
#> Warning: Check for down-regulation of CYP1A2, CYP2B6 and CYP3A4 by examplinib
#> $downregulation
#> # A tibble: 9 × 8
#> OBJECT DONOR n min_fold max_fold fold_maxc rho downregulation
#> <chr> <chr> <int> <dbl> <dbl> <dbl> <dbl> <lgl>
#> 1 CYP1A2 A 4 0.087 0.951 0.087 -1 TRUE
#> 2 CYP1A2 B 4 0.188 1.54 0.188 -0.8 TRUE
#> 3 CYP1A2 C 4 0.072 1.09 0.072 -1 TRUE
#> 4 CYP2B6 A 4 0.188 1.07 0.188 -0.8 TRUE
#> 5 CYP2B6 B 4 0.341 1.36 0.341 -0.8 TRUE
#> 6 CYP2B6 C 4 0.107 0.978 0.107 -1 TRUE
#> 7 CYP3A4 A 4 0.285 0.973 0.285 -0.2 TRUE
#> 8 CYP3A4 B 4 0.293 1.79 0.293 -0.8 TRUE
#> 9 CYP3A4 C 4 0.286 1.06 0.286 -0.8 TRUE
#>
#> $data
#> # A tibble: 9 × 7
#> # Rowwise: DONOR, OBJECT, ID
#> DONOR OBJECT ID data emax_obs mod modpar
#> <chr> <chr> <chr> <list<tibble[,4]>> <dbl> <list> <list>
#> 1 A CYP1A2 CYP1A2_A [4 × 4] -0.0490 <nls> <tibble [2 × 5]>
#> 2 A CYP2B6 CYP2B6_A [4 × 4] 0.0690 <nls> <tibble [2 × 5]>
#> 3 A CYP3A4 CYP3A4_A [4 × 4] -0.0270 <nls> <tibble [2 × 5]>
#> 4 B CYP1A2 CYP1A2_B [4 × 4] 0.535 <nls> <tibble [2 × 5]>
#> 5 B CYP2B6 CYP2B6_B [4 × 4] 0.356 <nls> <tibble [2 × 5]>
#> 6 B CYP3A4 CYP3A4_B [4 × 4] 0.79 <nls> <tibble [2 × 5]>
#> 7 C CYP1A2 CYP1A2_C [4 × 4] 0.0920 <nls> <tibble [2 × 5]>
#> 8 C CYP2B6 CYP2B6_C [4 × 4] -0.0220 <nls> <tibble [2 × 5]>
#> 9 C CYP3A4 CYP3A4_C [4 × 4] 0.0600 <nls> <tibble [2 × 5]>
#>
#> $fold_plot
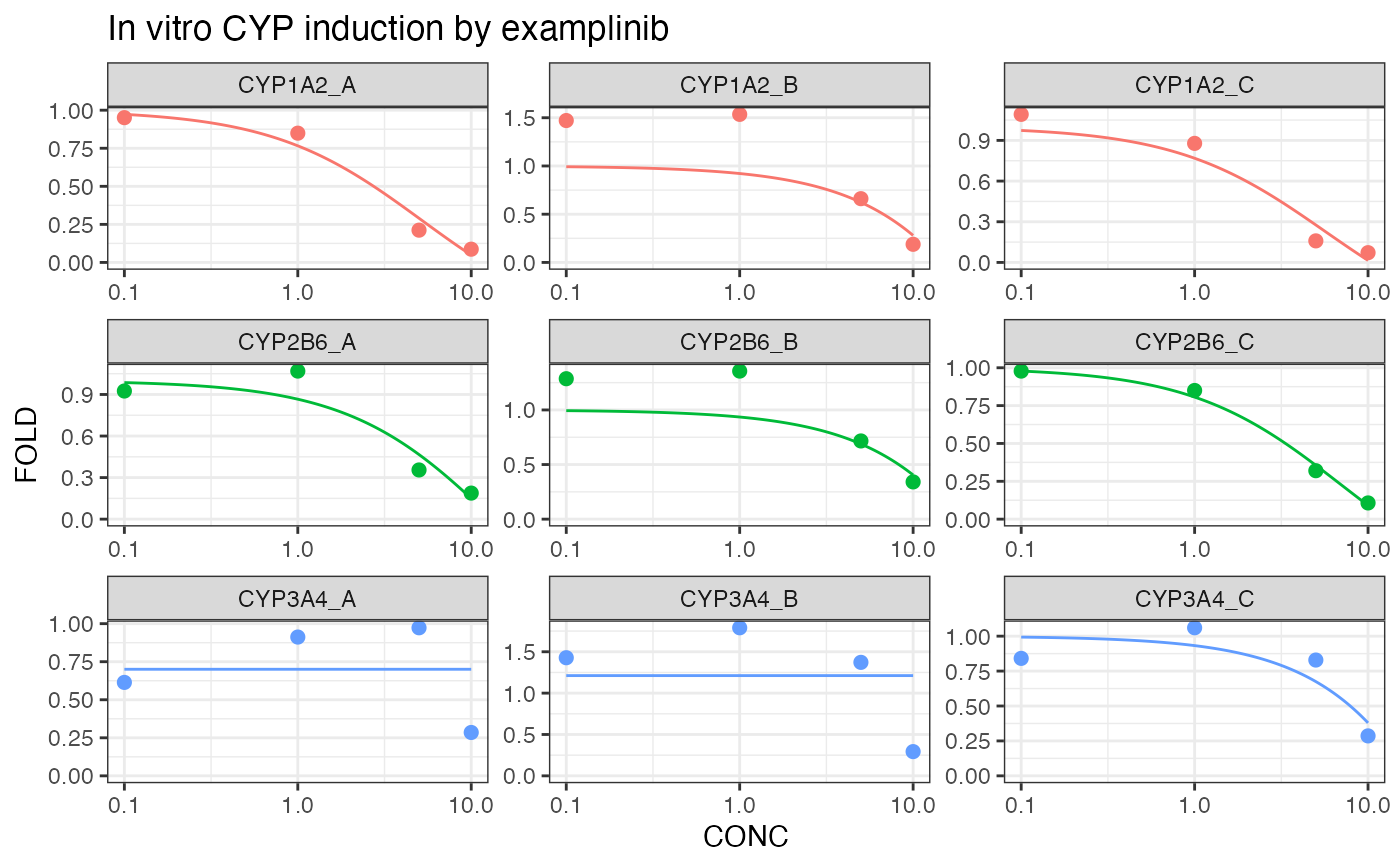 #>
#> $ind_param
#> # A tibble: 18 × 8
#> OBJECT DONOR term emax_obs estimate std.error statistic p.value
#> <chr> <chr> <chr> <dbl> <dbl> <dbl> <dbl> <dbl>
#> 1 CYP1A2 A ec50 -0.0490 5.16 3.21 1.61 0.249
#> 2 CYP1A2 A emax -0.0490 -1.44 0.388 -3.72 0.0652
#> 3 CYP1A2 B ec50 0.535 100 3575. 0.0280 0.980
#> 4 CYP1A2 B emax 0.535 -7.92 260. -0.0304 0.978
#> 5 CYP1A2 C ec50 0.0920 5.66 5.95 0.951 0.442
#> 6 CYP1A2 C emax 0.0920 -1.54 0.730 -2.11 0.169
#> 7 CYP2B6 A ec50 0.0690 14.6 31.6 0.463 0.689
#> 8 CYP2B6 A emax 0.0690 -2.09 2.92 -0.716 0.548
#> 9 CYP2B6 B ec50 0.356 100 2850. 0.0351 0.975
#> 10 CYP2B6 B emax 0.356 -6.55 172. -0.0382 0.973
#> 11 CYP2B6 C ec50 -0.0220 6.96 2.41 2.89 0.102
#> 12 CYP2B6 C emax -0.0220 -1.54 0.262 -5.88 0.0277
#> 13 CYP3A4 A ec50 -0.0270 0 0.155 0 1
#> 14 CYP3A4 A emax -0.0270 -0.300 0.234 -1.28 0.328
#> 15 CYP3A4 B ec50 0.79 0 0.449 0 1
#> 16 CYP3A4 B emax 0.79 0.212 0.478 0.443 0.701
#> 17 CYP3A4 C ec50 0.0600 100 1417. 0.0706 0.950
#> 18 CYP3A4 C emax 0.0600 -6.83 88.9 -0.0768 0.946
#>
#>
#> $ind_param
#> # A tibble: 18 × 8
#> OBJECT DONOR term emax_obs estimate std.error statistic p.value
#> <chr> <chr> <chr> <dbl> <dbl> <dbl> <dbl> <dbl>
#> 1 CYP1A2 A ec50 -0.0490 5.16 3.21 1.61 0.249
#> 2 CYP1A2 A emax -0.0490 -1.44 0.388 -3.72 0.0652
#> 3 CYP1A2 B ec50 0.535 100 3575. 0.0280 0.980
#> 4 CYP1A2 B emax 0.535 -7.92 260. -0.0304 0.978
#> 5 CYP1A2 C ec50 0.0920 5.66 5.95 0.951 0.442
#> 6 CYP1A2 C emax 0.0920 -1.54 0.730 -2.11 0.169
#> 7 CYP2B6 A ec50 0.0690 14.6 31.6 0.463 0.689
#> 8 CYP2B6 A emax 0.0690 -2.09 2.92 -0.716 0.548
#> 9 CYP2B6 B ec50 0.356 100 2850. 0.0351 0.975
#> 10 CYP2B6 B emax 0.356 -6.55 172. -0.0382 0.973
#> 11 CYP2B6 C ec50 -0.0220 6.96 2.41 2.89 0.102
#> 12 CYP2B6 C emax -0.0220 -1.54 0.262 -5.88 0.0277
#> 13 CYP3A4 A ec50 -0.0270 0 0.155 0 1
#> 14 CYP3A4 A emax -0.0270 -0.300 0.234 -1.28 0.328
#> 15 CYP3A4 B ec50 0.79 0 0.449 0 1
#> 16 CYP3A4 B emax 0.79 0.212 0.478 0.443 0.701
#> 17 CYP3A4 C ec50 0.0600 100 1417. 0.0706 0.950
#> 18 CYP3A4 C emax 0.0600 -6.83 88.9 -0.0768 0.946
#>